Bitcoin (BTC) Rainbow Map Close to Direction Change

#
Bitcoin (BTC) reached peak prices above $61,000 over the weekend on March 13-14, sparking enthusiasm for a swing at $100,000. But soon after that, the price went for slump in the new week, sliding to a range near $53,600. BTC still preserves its trillion-dollar market cap, but the talks of a market top once again enter social media discussion.
The new BTC buyers may be especially sensitive to those price swings, due to fears they once again bought near peak market and may have to wait out years of stagnant prices.
There are still limited tools to call top prices, but BTC has plenty of indicators to estimate the potential for a change in direction. Those indicators can help prevent panic-selling and reassess the investment potential of BTC.
Channel to $100,000 Still Possible
During this year’s BTC meteoric rise, calling the top has been a challenge. Drops of $10,000 did not hinder BTC from recovering to new highs. But there are indicators that the bull market may be closing in on its top price.
As of 2021, BTC certainly has more dedicated “hodlers”, who are willing to ride out the market without trading. But the short-term shifts in trends means either long or short traders get liquidated within minutes
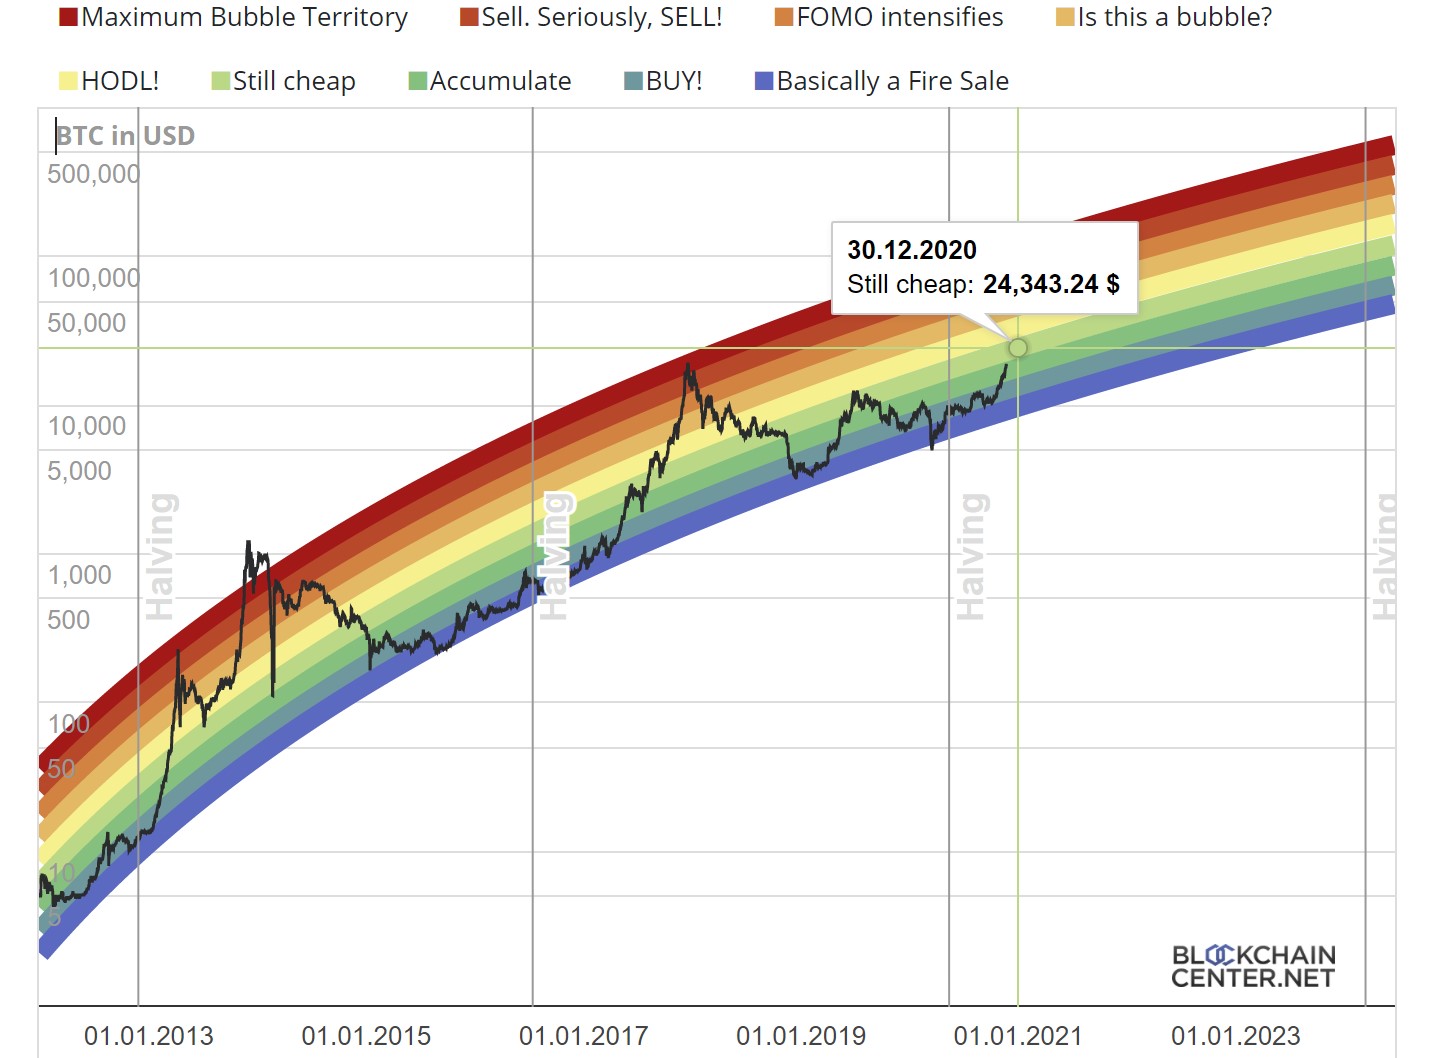
But there may be more volatility to come, as BTC moves into the more speculative, bubble-top stage of predictive charts. One of the models used to chart upcoming BTC moves and buying decisions is the rainbow chart. It tracks growth in the long term, but also plots the price vertical to measure risk. At nearly $60,000, BTC is not quite in the hottest stage of a bubble.
For some, the current stage calls for caution, but also opens the path to a peak near $100,000. As this level gets closer, most of the market has shorted the asset.
The latest correction toward $53,000 is viewed as a healthy signal, which does not negate the bullish case for continued growth. Until now, BTC prices have not only recovered, but continued to new highs. Prices moved in to regain the $55,000 level, with a potential for bullish development.
BTC right now balances its moods between bullish indicators and some caution that the price is near the top. The Fear and Greed Index still indicates “Extreme Greed”, but buying behavior has fallen. The index is down to 76 points, from 92 points a month ago.
Are Whales Ready to Sell?
There are some indicators that “whales” may be trying to cash out. Based on Cryptoquant data, there are indications of inflows with the potential intention to sell some of the coins. Exchange net inflows resemble the time of the latest peak of BTC prices to above $58,000.
Exchange flows have affected price action for some time. But this time, fire sales are less likely. However, in the short term, the current BTC conditions serve as a warning to over-leveraged traders in both short and long positions.
As of March 2021, there were 48 “whale” wallets with BTC worth more than $1B. There is significant ownership in the wallet weights holding 10-10,000 BTC, which are high net worth, but may also be sources of speculative trades. Up to 50% of coins are held in wallets of this size, though there is no way to track how many real persons or businesses own the wallets.
Tether to the Rescue?
Tether (USDT) has always been one of the most valuable resources for predicting BTC price moves. After the latest price slump, USDT added more than 1B coins to its balance, ostensibly revealing new buying interest.
The USDT supply is important, to boost the most active trading pairs on crypto-to-crypto exchanges. For now, the USDT price still tracks closely the USD price on fiat exchanges like Coinbase.
The significant USDT supply may continue to boost BTC trades and preserve gains made during the 2021 bull market.
Time to Buy In?
The BTC rainbow chart hovers between two distinct moods and two potential scenarios. A little higher and BTC enters “FOMO” territory, with illogical buying in expectation of fast gains.
The other possible scenario is a drop into more doubt, seeing BTC as a bubble and bracing for deflation. The $50K range is a call to hold onto the coins, awaiting the turbulence to pass.
For BTC, moving by thousands of dollars per day is not new in this price range. Drops of up to 30% have also happened quarterly in the past, at various price ranges. But with a bigger ecosystem and record trading volumes, BTC is in a new phase of price discovery, with bullish long-term predictions.
Even the three-year bear market serves as a map to the range of BTC and the potential for loss and recovery.
#
With over 50 coins and an obsession with security, Kraken is one of the safest places to buy and trade crypto.

Kraken has a good reputation for security and protection of your funds and operates across the USA (except NY), Canada, the EU and Japan

What do members of the public think about Crypto in 2021/22? We survey some UK people and look at search data with some surprising results.

Eight ways to buy Bitcoin without needing ID or giving personal information

This is a specific digital coin running on a series of servers. XRP promises utility in handling cross-border transactions to compete with the SWIFT interbank payment system. Being controlled by banks, many question if it is a true cryptocurrency.

The first cryptocurrency. It has limitations for transactions but it is still the most popular being secure, trusted and independent from banks and governments.